1. What a bond is
A bond is a loan. That single sentence carries most of what matters, and the rest of this lesson is an unpacking of it.
When you buy a share, you become a part-owner of a company. When you buy a bond, you become a lender. The relationship is the ordinary one between anyone who borrows and anyone who lends, with one difference: the loan has been written down, standardised, and made tradable, so it can pass from hand to hand long after it was first made. That tradability is what separates a bond from the loans most people know firsthand. The mortgage from your bank, or the money you once borrowed from family or friends, cannot be handed to a stranger on a whim; transferring it would mean renegotiation, fresh paperwork, and probably a few tough conversations. A bond is built from the outset to change hands, its terms fixed and public, so ownership can move from one investor to another in seconds, without anyone reopening the deal.
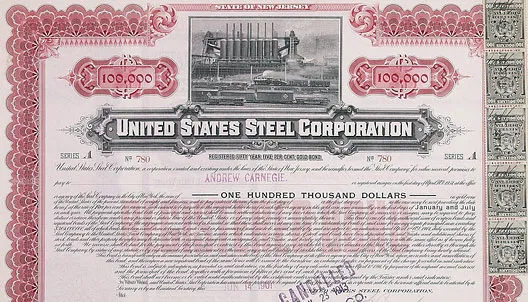
The borrower is called the issuer. It might be a government raising money to fund its spending, or a company financing a new factory. In exchange for your money today, the issuer makes a written promise: to pay you interest at set dates, and to return the original sum on a stated future date. The certificate at the top of this page is one of those promises in physical form, a United States Steel bond from the early twentieth century, signed and sealed. The paper has left modern markets, but the promise it represents has not changed.
Three numbers define a plain bond.
The first is the face value, also called the par value or the principal. This is the amount the issuer promises to repay at the end. It is the size of the loan as the bond records it, usually a round figure, often 1,000 in the relevant currency.
The second is the coupon, the interest the issuer pays for the use of your money, expressed as a percentage of the face value. A bond with a face value of 1,000 and a coupon of 5% pays 50 a year. The word is a relic of those paper certificates: bonds once came with detachable coupons that the holder clipped and presented to collect each payment. You can see the perforated coupons running down the right edge of the US Steel certificate above.
The third is the maturity, the date on which the loan ends and the issuer repays the face value. A bond issued today that matures in ten years pays its coupons across that decade, then returns the principal at the close.
Put the three together and the shape of a simple bond appears. Lend 1,000 to an issuer at a 5% coupon for ten years, and you can expect 50 each year for ten years, and your 1,000 back at the end. The stream of payments is largely known in advance, which is why bonds, as a group, are called fixed income.
Illustrative cash flows for a plain ten-year bond. The investor pays 1,000 at the start, collects a 50 coupon at the end of each year, and is repaid the 1,000 principal at maturity, alongside the final coupon. Heights are schematic, not drawn to scale.
That known stream is the heart of the difference between a bond and a share. A shareholder owns a piece of a business and shares in whatever it becomes, for better or worse. A bondholder owns a promise: a claim to be paid specific amounts on specific dates, ranking ahead of the shareholders if the issuer runs into trouble. The shareholder asks how high the company can climb. The bondholder asks a narrower, more cautious question: will I be paid what I was promised, and on time.
One feature worth flagging now, because it catches almost everyone out: once a bond is trading, its price and its yield move in opposite directions. When the price rises, the yield falls; when the price falls, the yield rises. It feels backwards at first. Section 4 explains exactly why; for now, simply hold on to the idea that price and yield are two sides of the same coin.
Everything that follows, prices, yields, duration, credit, and the rest, is built on that promise and the question it raises.
2. Who issues bonds, and why
This is not a market for small sums, and that single fact decides who is in it. A public bond issue is typically counted in the hundreds of millions, and a liquid benchmark deal often runs to 500 million or a billion in the relevant currency, sometimes far more. The fixed costs of coming to market, the underwriting, the legal work, a credit rating, and the continuing duty to disclose to investors, only pay off when the amount raised is very large. So the bond market belongs to large institutions: national governments and sizeable companies. Your local bakery or regional contractor, however well run, is simply too small to issue a bond, and borrows from a bank instead. Size is the first filter, and it is a high one.
With that threshold in mind, start with the largest borrowers on earth: governments. A national government spends more than it collects in tax in most years, and it covers the difference by borrowing. It does so by issuing bonds, and because the sums are vast and the borrowing is continuous, the market for government debt is the deepest and most heavily traded in the world. These instruments carry familiar names: Treasuries in the United States, gilts in the United Kingdom, Bunds in Germany, OATs in France. A government borrowing in its own currency is treated, in that currency, as the safest borrower there is, since in the last resort it controls the money in which it must repay. That is why government yields serve as the benchmark against which almost every other bond is priced, a point the lesson returns to under yields and spreads.
Between the sovereign and the company sit several issuers worth knowing. Government agencies borrow to fund specific public purposes, often with the explicit or implicit backing of the state behind them. Supranational institutions, bodies owned by groups of governments such as the World Bank, the European Investment Bank, and the EBRD, raise money to finance development and infrastructure across borders. And below the national level, sub-sovereign issuers, the American states and municipalities, the German Länder, the Canadian provinces, borrow for roads, schools, and utilities. These are different flavours of public borrowing, each with its own degree of safety and its own investor base.
Then there are companies. A corporation that wants to build a factory, fund a takeover, or refinance older debt can raise the money by borrowing, and for large amounts over long periods the bond market is often the natural place to do it. Corporate issuers run the full range of credit quality, from the blue-chip names whose promise to repay is barely in doubt, the investment-grade tier, down to weaker or more indebted borrowers who must pay more to compensate lenders for the added risk, the high-yield tier. That spectrum is the subject of a later section on credit; for now it is enough to know that the word corporate covers everything from the safest industrial giant to the most stretched young company.
Why borrow this way at all, rather than simply taking a loan from a bank? Three reasons recur. The first is scale: a single bank may be unwilling or unable to lend a borrower several billion at once, whereas a bond spreads that sum across thousands of separate investors, each taking a manageable slice. The second is maturity: banks tend to lend for a few years, while bonds can run for ten, thirty, or in rare cases a hundred, letting a borrower lock in funding for a generation. The third is price and independence: a strong borrower can often raise money more cheaply in the public market than from a bank, and tapping many lenders reduces its dependence on any single one.
A company has one further choice that a government does not. It can raise money by selling part of itself, issuing shares, or by borrowing, issuing bonds. Bonds do not hand over ownership or a vote; they are a debt to be repaid, not a stake to be shared. The decision between the two, the capital structure, sits at the centre of corporate finance, and the bondholder's place within it is something the lesson takes up again under covenants and the capital structure.
3. The global bond market
Most people picture the stock market when they think of "the markets," yet the bond market is substantially larger. The total value of bonds outstanding worldwide is roughly 145 to 150 trillion dollars (BIS and SIFMA, end-2024), more than the combined value of every listed company on earth. By size, it is the deepest pool of capital in the world. It sets the price of borrowing for governments and companies alike, and in the end for everyone else too: the yields struck here flow through to your mortgage rate, your consumer credit, and the cost of money for all of us.
That vast market has two halves. The primary market is where bonds are born: a government or company issues new bonds and sells them, usually through banks, to raise money. The cash flows from investors to the issuer, once. The secondary market is everything that happens afterwards: investors buying and selling those existing bonds among themselves. No new money reaches the issuer here, ownership simply changes hands, and it is in this secondary trading that a bond's price moves, and with it the yield.
Here the bond market parts company with the stock market in a way that surprises newcomers. Shares mostly trade on a central exchange, a single visible venue where buyers and sellers meet and every price is published. Most bonds do not. They trade over the counter, which means bilaterally, by negotiation, usually through a dealer. A dealer, typically a bank, stands ready to buy bonds from sellers and sell to buyers, quoting a price to buy, the bid, and a slightly higher price to sell, the ask, and earning the difference between them. An investor wanting to trade does not watch a single exchange screen; they ask one or more dealers, often through a broker, for a price. There are exceptions, some government and retail bonds are exchange-listed, but the overwhelming majority of bond trading happens in this decentralised, dealer-based, over-the-counter market.
One consequence matters more than any other: liquidity, the ease of buying or selling without moving the price, varies enormously from one bond to the next. The most heavily traded government bonds, US Treasuries above all, are among the most liquid instruments in existence; an investor can buy or sell vast amounts in seconds at a razor-thin spread. A large, recently issued bond from a household-name company is usually liquid enough. But a small issue, an older bond that has settled into long-term portfolios, or a bond from a weaker borrower can be hard to sell at all without accepting a worse price. The same word, bond, covers instruments as liquid as cash and instruments that may take days to offload. That difference is invisible on the day you buy and decisive on the day you need to sell.
So the bond market is the largest in the world, divided between the issuance that funds borrowers and the secondary trading that prices their debt, and conducted, for the most part, not on a bright public exchange but in a quieter network of dealers. Keep the liquidity point in mind: it returns under the risks of a bond, where the danger of being unable to sell when you wish has a name and a price.
4. How a bond is priced, and the price-yield relationship
In section 1 we flagged a fact that seems backwards: a bond's price and its yield move in opposite directions. Here is why, and it rests on a single idea, present value.
A pound, dollar, or euro promised a year from now is worth less than one in your hand today, because money in hand can be put to work in the meantime. To compare a future payment with a present one, you discount it: you shrink it by a rate that reflects what you could earn elsewhere and the risk that you might not be paid. The further off the payment, the more it is shrunk.
A bond is nothing but a set of future payments: the coupons, year by year, and the face value at the end. To price the bond, you discount every one of those payments back to today and add them up. The single rate used to do the discounting is the bond's yield. Pay that price and hold the bond to maturity, and the yield is the return you earn. This is why the market's headline measure of a bond's return is called the yield to maturity, the rate that makes the present value of all the future cash flows equal to the price you pay. (Section 5 takes the different kinds of yield apart; here only this one matters.)
Now the inverse relationship falls out on its own. The cash flows are fixed: a 5% coupon on a face value of 100 pays 5 a year, whatever happens. If the yield used to discount them rises, every payment is shrunk harder, and their sum, the price, falls. If the yield falls, every payment is shrunk more gently, and the price rises. Same cash flows, a different discount rate, an opposite price. Price and yield are the two ends of one seesaw.
That seesaw has a balancing point. When the yield equals the coupon, the bond is worth its face value: it trades at par. When the yield is below the coupon, the bond's above-market coupons are worth paying extra for, and it trades at a premium, above face value. When the yield is above the coupon, the bond's coupons look stingy, and it trades at a discount, below face value. Par, premium, discount: three words for where the seesaw sits.
The relationship is not a straight line. The chart above plots a bond's price against its yield, and the result is a curve that slopes downward and bows gently. The downward slope is the inverse relationship itself. The bow, the fact that the line is curved rather than straight, is a property called convexity. And the steepness of the curve depends on how long the bond has to run: a longer bond's price reacts far more violently to a change in yield than a short one's, a sensitivity called duration. Both have their own treatment in section 7.
The instrument below lets you feel all of this directly. Set the coupon, the maturity, and the yield, and watch the price respond: drag the yield up and the price slides down the curve, drag it back to the coupon and the bond snaps to par, stretch the maturity and watch the same change in yield move the price much more. The strip beneath shows each cash flow shrinking into its present value, the discounting that sets the price, happening in front of you.
5. Types of yield, and the yield curve
When someone says a bond yields 4 percent, the honest follow-up is a question: which yield? The single word hides at least three different measurements, and on the same bond they can disagree sharply. Knowing which one is being quoted is much of the difference between understanding a bond and being sold one.
The simplest is the coupon rate, also called the nominal yield: the annual coupon divided by the bond's face value. A 100 bond paying 5 a year has a 5 percent coupon, and that figure is fixed for the life of the bond. It tells you the size of the cheque. It tells you very little about your return, because it ignores the price you actually paid.
The current yield repairs part of that. It divides the annual coupon by the bond's market price instead of its face value. Buy that same 5 percent bond for 80 rather than 100, and its current yield is 5 divided by 80, or 6.25 percent. That is closer to what your money earns, but it still misses something large: the pull to par. A bond bought at 80 drifts back toward 100 as maturity approaches, and that capital gain is part of the return. Current yield cannot see it.
The measure that sees all of it is the yield to maturity, or YTM: the single discount rate that makes the present value of every coupon plus the final principal equal the bond's price. It is the yield in the interactive pricer above, and it is the number the market actually trades on. YTM carries assumptions worth remembering, that you hold to maturity and, in its textbook form, reinvest each coupon at that same rate, but it is the only one of the three that accounts for price, coupons, their timing, and the return of principal at once. When a professional quotes the yield, this is almost always what they mean.
Two close relatives are worth naming now and meeting properly later. Some bonds let the issuer repay early, on set dates and at set prices. For those, the yield to call recomputes the YTM assuming the bond is redeemed at its first call date, and the yield to worst reports whichever outcome, called or held, leaves the investor with the lowest yield. They matter because a bond advertised at an appealing YTM can deliver far less if the issuer calls it away. These belong to callable and other special bonds, which a later section covers; for now it is enough to know that the yield is not always one fixed number.
So far we have priced one bond at a time. Step back, take many bonds from a single issuer, and plot each one's yield to maturity against how long it runs, from a few months to thirty years. The line you get is the yield curve. Built from government bonds, it is among the most watched pictures in finance, because it shows the price of time itself: what lenders require to part with money for three months versus ten years.
The curve usually slopes upward. Lending for longer ties up money and carries more uncertainty, so longer maturities normally pay more; this is a normal curve. Sometimes it goes flat, short and long yields converging, which tends to signal a market unsure where rates are heading. Occasionally it inverts, short maturities yielding more than long ones, which says investors expect rates, and often growth, to fall.
What sets the curve's shape is mostly expectations. A long yield is, in large part, the average short-term interest rate the market expects over the bond's life, plus a term premium for the added uncertainty of lending far into the future. And because lenders care about what their money will buy back, not only the number of dollars returned, those expected rates carry inflation expectations inside them. A nominal yield can be read, roughly, as a real yield plus the inflation the market expects over the same horizon. So when investors come to expect inflation running hotter for longer, they demand more to hold long bonds and the curve steepens; when they expect inflation and growth to cool, long yields fall and the curve flattens or inverts. Read this way, the curve is a continuously updated poll of what the market expects inflation and interest rates to do.
The inverted curve has earned its reputation. In the United States a negative term spread has preceded every recession since the mid-1950s, with a single false alarm in the mid-1960s (Federal Reserve Bank of San Francisco, 2018). But a signal that fires before every recession is not a clock. Its lead time has ranged from a few months to roughly two years, and it describes a regularity with a plausible mechanism behind it, not a law. The honest reading is that an inverted curve is information to take seriously, not a date on the calendar.
6. Yields and spreads
Two bonds can mature on the very same day and still offer very different yields. Picture a ten-year US Treasury yielding 4.5 percent and a ten-year bond from a manufacturer yielding 6 percent. Same maturity, yet a percentage and a half apart. That gap has a name, and reading it is most of what separates a government-bond investor from a credit investor.
The gap is the spread: the extra yield a bond pays over a risk-free benchmark of the same maturity, which in practice means the government bond. Spreads are quoted in basis points, where one basis point is one hundredth of a percentage point, so the gap above, 1.5 percent, is a spread of 150 basis points. For any bond that is not issued by a government, the spread is not a footnote to the yield. It is the part the investor is really being paid to judge.
Why accept the Treasury's lower yield at all? Because the Treasury carries no meaningful default risk: a government that borrows in a currency it prints can always pay you back in that currency. A company can run out of money and fail to pay. The spread is the compensation an investor demands for bearing that possibility, with smaller premiums layered on for the fact that the corporate bond is harder to sell in a hurry and may be taxed less favourably. Because default risk is usually the largest piece, the spread over governments is often called the credit spread.
The market does not charge every borrower the same. Rating agencies sort issuers on a scale that runs from AAA at the safe end down through BBB, and then into the riskier BB, B, and CCC. One line on that scale carries real weight: bonds rated BBB and above are investment grade, while everything below is high yield, or less politely, junk. The lower the rating, the greater the perceived chance of default, and the wider the spread the market demands to hold the bond. The graph below shows that ladder as of 17.06.2026.
A spread is not a fixed toll. It moves constantly as the market reprices the odds of default. When investors turn fearful, in a recession, a banking scare, a credit crunch, they demand far more to hold risky bonds and spreads widen, sometimes violently; in the 2008 crisis the spread on the riskiest bonds rose several times over in a matter of months. When confidence returns, spreads narrow again. This makes the credit spread one of the most candid instruments on the dashboard: a continuously updated reading of how much the market is charging for risk. A widening spread is the bond market raising its guard; a narrowing one is the bond market lowering it.
It is tempting to read a narrow spread as good and a wide one as bad. The more useful reading is that the spread tells you what you are being paid, not whether you are being paid enough. A wide spread pays generously precisely because the danger is real; a narrow spread may mean the danger has passed, or only that investors have stopped pricing it. The question the spread poses, and never answers on its own, is whether the compensation in front of you matches the risk you are actually taking.
7. Credit risk and ratings
Section 6 ended on the ladder of spreads, the market's price of credit risk. The natural next question is how that risk is measured, and how well. Credit risk is the plainest risk a bond carries: the chance that the borrower fails to pay what was promised, in full or on time.
The dominant instrument for measuring it is the credit rating. Three firms, S&P, Moody's and Fitch, the so-called Big Three, dominate the business of grading borrowers on a letter scale that runs from AAA at the top down through BBB, BB, B and CCC to D, which means default. The same dividing line we met with spreads applies here: AAA to BBB is investment grade, while BB and below is speculative grade, high yield, or junk. A rating is explicitly an opinion about the relative likelihood of default. It is not a guarantee, and it is not a recommendation to buy.
Do the letters mean anything? The longest record we have suggests they do, on average and across decades. S&P has tracked the fate of every company it rates since 1981, and the pattern is consistent: the lower the rating, the more often default actually follows. Over a single year, AAA and AA issuers almost never default, the whole investment-grade group defaults about 0.08 percent of the time, and the speculative-grade rate is many times higher. The graph below lets you see the full ladder, and stretch it over time.
Two things stand out. First, the ranking holds: at every horizon, a worse rating defaults more often than a better one, which is exactly what a useful instrument should do. Second, default compounds. Over a single year a CCC issuer defaults about 26 percent of the time; stretch the horizon to ten years and roughly half of all CCC issuers have defaulted, against under 3 percent for BBB. Time is the enemy of a weak balance sheet, and the rating is a fair guide to how quickly that enemy tends to arrive.
Read across the years and the cyclicality is unmistakable. Default rates do not drift gently. They sit low through expansions and then spike, hard, when the economy turns. The peaks line up with the recessions and credit shocks of the past four decades: the early 1990s downturn, the bursting of the dot-com and telecom bubble in 2001 and 2002, the global financial crisis that pushed the 2009 rate close to 10 percent, the 2016 energy slump, and the COVID shock of 2020. Between those episodes the rate falls back toward its long-run average of about 3.9 percent, and as of 2025 it sits a little below that, a calm reading by historical standards. The lesson for a bond investor is that credit risk is not spread evenly through time: it stays quiet for years and then arrives all at once, which is exactly when a portfolio's weakest holdings tend to fail together.
Ratings are not fixed, either. They migrate. In a typical year a BBB issuer has about an 87 percent chance of still being BBB twelve months later, roughly a 3 percent chance of being upgraded to A, and a similar chance of slipping to BB. That last move has a name and a sting: an investment-grade bond downgraded into high yield is a fallen angel, and the downgrade often forces funds that may only hold investment grade to sell, widening the spread further just as the bad news lands.
So the grades carry real information, and that is the honest case for them. But the instrument has serious flaws, and the distance between useful on average and trustworthy in any single instance is exactly where investors get hurt.
The deepest flaw is who pays. Since the 1970s the agencies have run an issuer-pays model: the company being graded is also the customer paying for the grade. The conflict barely needs spelling out. The customer would prefer a high rating, and the agency would prefer to keep the customer. Layer on rating shopping, where an issuer quietly sounds out the agencies and publishes only the most flattering result, and the whole apparatus tilts gently toward leniency.
That tilt turned catastrophic in 2007 and 2008. The agencies awarded AAA, their safest grade, to vast quantities of mortgage-backed securities and collateralised debt obligations that then defaulted on a scale their models had treated as almost impossible. The fees had been large, the assumptions convenient, and the AAA stamp had carried those products into exactly the conservative, regulated portfolios that should never have held them.
Other criticisms are quieter but persistent. Ratings tend to lag: a downgrade often arrives after the market has already repriced the bond, then deepens the fall, a procyclicality that amplifies stress rather than warning of it. And three firms grade most of the world's debt, a position cemented by decades of regulation that wrote their letters directly into law, into bank capital rules and the investment mandates of pension funds and insurers.
That last point breeds a subtler problem: moral hazard. When a rating is required by regulation and trusted by everyone, investors quietly stop doing their own credit work and outsource the judgment to a letter. The legal scholar Frank Partnoy put the sharp version: ratings may matter less because they genuinely inform than because rules require them, a regulatory license that the agencies are paid to sell. Either way, the presence of the rating changes behaviour, and a market that has stopped looking past the grade is more fragile, not less.
Hold both truths at once. A rating is a genuinely useful starting instrument, the distilled opinion of analysts with access and a long record behind them, and the default data shows that record is real. It is also an opinion, paid for by the issuer, often late, and occasionally very wrong. The moment a rating is treated as a verdict rather than a place to begin is the moment it becomes dangerous. The instrument tells you where to look first. It does not excuse you from looking.
8. Duration, and a word on convexity
Section 4 established that a bond's price moves opposite to its yield. Duration answers the next question: by how much. Duration measures how sensitive a bond's price is to a change in interest rates. A bond with a duration of seven loses roughly 7 percent of its value if its yield rises by one percentage point, and gains roughly 7 percent if its yield falls by one. It is the single most useful number for gauging a bond's interest-rate risk.
The word carries two related meanings. Macaulay duration, the original, is the weighted average time, in years, until you receive the bond's cash flows; a longer wait means more exposure to rate changes along the way. Modified duration turns that into the practical sensitivity above: the approximate percentage change in price for a one percentage point change in yield. When practitioners say a bond has a duration of seven, they almost always mean the modified version.
Three forces set a bond's duration. Maturity: the longer the bond, the higher its duration, because more of its value sits far in the future. Coupon: the lower the coupon, the higher the duration, because less is returned early, and a zero-coupon bond, which pays nothing until maturity, has the highest duration of all, equal to its maturity. Yield: the lower the prevailing yield, the higher the duration. The practical consequence is that long, low-coupon bonds in a low-rate world are the most sensitive to rate moves, which is exactly the combination that inflicted heavy losses when rates rose sharply in 2022.
Duration is useful because it puts very different bonds on a single scale of risk. A three-year and a thirty-year bond, a government and a corporate, can all be compared by their duration, and a portfolio's overall sensitivity is roughly the average of its holdings' durations. A manager who expects rates to rise shortens duration to soften the blow; one who expects rates to fall extends it to capture the gain. The graph below shows duration as what it really is: the slope of the price-yield curve at the current yield.
But that slope is a straight-line approximation, and the true price-yield relationship is curved. Convexity is the name for that curve, and for an ordinary bond it works in the investor's favour. Because the real price line bows above the straight duration estimate, a falling yield lifts the price by more than duration predicts, while a rising yield costs less than duration predicts. The gap you can watch opening between the line and the curve in the graph is the convexity benefit. It is slight for small moves and grows with the size of the move, which is why duration alone is a fine guide for a quarter-point shift and a poor one for a crisis.
Two cautions keep these tools honest. Both assume the whole yield curve moves in parallel, when in practice short and long rates move by different amounts, so a single duration number can mislead. And duration itself changes as yields change, so today's figure is a snapshot, not a constant. Used with those limits in mind, duration and convexity are the bond investor's altimeter and rate of climb: the first tells you how far a move in rates will carry your price, the second tells you the ride is a little gentler than the straight-line gauge suggests.
9. The risks of a bond
We have met several of a bond's risks already, in passing. Because risk is the heart of the matter, this section gathers the main ones in a single place. Some are obvious and stare back at you from the page; others are quieter, and do their damage precisely because they are easy to ignore.
The obvious risk is default: the borrower simply fails to pay. The quieter ones we have already met under other names. Interest-rate risk, the chance that rising yields cut the price of a bond you hold, is measured by duration (Section 8). Inflation risk is the slow erosion of a fixed coupon's purchasing power, the reason even a default-free government bond is not truly risk-free. Liquidity risk is the cost of selling before maturity, the bid-ask spread you must cross and the haircut it implies (Section 12). Reinvestment risk is being forced to put coupons and maturing cash back to work at lower rates than you started with. Call risk is the issuer repaying early just when it suits them and not you, captured by yield-to-worst (Section 5). And currency risk attaches to any bond paid in a currency that is not your own. Each deserves attention; the rest of this section dwells on the one that ends careers.
Section 7 gave the odds of default by rating. What it did not say is what happens when default actually arrives, and the answer is rarely all or nothing. What you get back is the recovery rate, the cents on the dollar returned once the process is done, and it depends above all on where your claim sits in the capital structure. Secured lenders at the top recover the most; subordinated bondholders at the bottom recover the least. The graph below shows the long-run averages.
How that recovery is reached differs for each kind of borrower. A company enters a bankruptcy court, where, under the rule of absolute priority, claims are paid in order of seniority, often by reorganising the business (Chapter 11 in the United States) rather than liquidating it. A sovereign has no court that can seize a nation's assets, so it restructures by negotiation, offering creditors new bonds worth a fraction of the old; a holdout minority can refuse, which is why modern sovereign bonds carry collective action clauses to bind everyone to a deal a supermajority accepts. A bank is handled differently again: regulators now impose a bail-in, forcing the bank's own bondholders, and sometimes its large depositors, to absorb losses so that taxpayers need not. The most famous holdout fight of all is worth seeing in full.
Argentina was one shape of default. A summary of some other famous ones:
- Cyprus, 2013. The rescue of its banks was funded by a bail-in, not by taxpayers: junior bondholders of the two largest banks were wiped out, Laiki Bank was wound down, and large uninsured depositors at Bank of Cyprus saw much of their money converted into equity. It became the template for making creditors, not governments, absorb bank losses.
- Lehman Brothers, 2008. The largest bankruptcy in US history, with more than 600 billion dollars of debt. Its senior unsecured bonds settled at about 9 cents on the dollar in the credit-default-swap auction; years of liquidation eventually returned more, but slowly.
- Evergrande, 2021 to 2024. The Chinese property developer defaulted with more than 300 billion dollars of liabilities. A Hong Kong court ordered its liquidation in 2024, leaving offshore bondholders expecting only a few cents on the dollar, and only after years, while onshore homebuyers and creditors were placed first.
- Credit Suisse AT1, 2023. In the emergency takeover by UBS, about 17 billion dollars of Additional Tier 1 (AT1) bonds were written down to zero while shareholders still received around 3 billion, inverting the usual order in which bonds rank above equity. Tellingly, the bank's ordinary senior unsecured bondholders lost nothing: only the subordinated AT1 holders were wiped out, a sharp reminder of how much it matters where in the capital structure you actually stand. Some bondholders called the write-down unlawful and challenged it: in October 2025 the Swiss Federal Administrative Court agreed and struck it down, an early victory at the first level that the regulator is appealing and that the Federal Supreme Court must still confirm or reverse (as of 19 June 2026, the bonds remain written down). These loss-absorbing instruments get their own treatment in the Special Bonds section.
The thread running through all of them is the same. A bond is a promise to pay, and the worth of a promise is revealed only when it is tested. The rating tells you how likely the test is to come; the recovery, the seniority, and the long fight that follows tell you what is left when it does. An investor who studies only the first half of that sentence has read only half the risk.
10. Covenants and the capital structure
Two structural facts decide how safe a bond really is, and neither shows up in the coupon or the rating. The first is where the bond sits in the issuer's capital structure, the order in which everyone gets paid if things go wrong. The second is what the bond's covenants permit the borrower to do while the money is owed. This section takes them in turn.
A company is financed in layers, and those layers form a strict queue. At the top sit secured lenders, whose loans and bonds are backed by specific collateral; at the very bottom sit the shareholders, whose equity is the residual, entitled only to whatever is left. In between run the unsecured and subordinated tiers of debt. When a borrower defaults, claims are settled from the top of the queue downward, under the principle of absolute priority: each layer is paid in full before the next sees a cent, and the bottom layers absorb the losses first. This is exactly why recovery rates fall so sharply with seniority, as Section 9 showed. The diagram below lays the queue out in full.
Two things follow from this queue. First, statutory claims often jump it: in many countries unpaid wages, taxes, and social-security contributions rank ahead of ordinary bondholders, a reminder that the law, not only the contract, sets the order. Second, and more important for an investor, two bonds from the very same company can carry completely different risk depending only on their rank. Credit Suisse is the vivid case: in 2023 its subordinated AT1 bonds were written to zero while its senior unsecured bonds were untouched. Same issuer, same crisis, opposite outcomes. Before buying any bond, the first question is not what it yields but where in this stack it stands.
Rank can also be decided by a piece of corporate plumbing that catches even seasoned investors: structural subordination. A large group is usually a parent holding company sitting above the operating subsidiaries that own the factories and earn the cash. A bond issued by the parent ranks behind the bonds and lenders of those subsidiaries, because the subsidiaries' own creditors have first claim on the assets that actually produce the money; the parent, like a shareholder, receives only what flows up after they are paid. Two bonds from the same group, identical on paper, can therefore sit a tier apart in reality, purely because of where in the corporate tree they were issued. Ranking, in the end, is set by the structure and the documents as much as by collateral, the same family of fine print as the pari passu clause that ensnared Argentina in Section 9.
Rank tells you what you would recover after a default; covenants are the promises in the bond's documentation meant to stop the default from happening, and to protect you if it starts to threaten. A bond is governed by a long contract, the indenture, and a trustee enforces its terms on behalf of all the holders at once. Covenants come in two kinds. Affirmative covenants are things the issuer must do, such as publish audited accounts, keep its assets insured, and stay within agreed financial ratios. Negative covenants are things it must not do without permission, such as borrowing beyond a limit, paying large dividends, selling key assets, or pledging collateral to other lenders ahead of you. Breach one and you may have an event of default, which, alongside a missed payment, a bankruptcy filing, or a cross-default triggered by trouble on the issuer's other debt, lets the trustee declare default and demand immediate repayment, an acceleration.
The covenants worth knowing, in brief:
- Limitation on debt. Caps how much more the issuer can borrow, usually through a leverage or interest-coverage test.
- Limitation on liens (negative pledge). Stops the issuer pledging assets to other lenders ahead of you.
- Restricted payments. Limits dividends, buybacks, and other cash leaving to shareholders.
- Limitation on asset sales. Restricts selling key assets, or requires the proceeds to repay debt.
- Change-of-control put. Lets you sell the bond back, usually at 101, if the company is taken over.
- Cross-default. A default on any of the issuer's other debts counts as a default on yours.
- Reporting and maintenance. The issuer must publish accounts and stay within agreed financial ratios.
Those triggers, set out in full, are the bond's events of default: the specific circumstances that let the trustee step in on behalf of all holders. An indenture usually lists about six.
- Non-payment. Failure to pay a coupon (usually after a short grace period, often 30 days) or to repay principal when it falls due.
- Breach of covenants. Failure to honour the bond's other promises, typically after notice and a period to put it right.
- Cross-default. A default on the issuer's other debt, above an agreed threshold, counts as a default here too.
- Insolvency or bankruptcy. The issuer files for bankruptcy, is placed into liquidation, or admits it cannot pay its debts.
- Unpaid judgments. Large final court judgments against the issuer left unsatisfied.
- Failure of guarantees or security. A guarantee or the collateral backing the bond ceases to be valid.
The third of these carries the sharpest sting. Through cross-default and cross-acceleration, a single missed coupon on one small bond can throw the issuer into default across its entire debt at once, and acceleration can then make the full principal of every bond fall due immediately. A trivial slip on a minor obligation can, in this way, bring down the whole structure, which is why borrowers guard their payment dates so fiercely and why these clauses sit at the heart of the contract.
How much of this protection you actually get varies, and not always in the direction you would hope. Bank loans usually carry the tightest covenants, high-yield bonds carry meaningful ones because the risk demands it, and investment-grade bonds are often nearly covenant-lite, trusting the issuer's quality in place of contractual restraint. Some bonds add a rating trigger, a coupon that steps up if the issuer is downgraded, paying you more precisely as the risk rises. The catch, worth examining, is that in easy-money years the protections erode: investors hungry for yield accept looser and looser terms, and learn only in the next downturn how little the documents actually defend them.
So the coupon advertises the reward, but the capital structure and the covenants describe the risk behind it. One tells you where you would stand when the money runs short; the other tells you what you are allowed to do about it beforehand, and how early you can act. An investor who reads only the headline rate has read the marketing, not the contract.
11. Special bonds
Everything so far has described what the market treats as a standard bond: senior unsecured, paying a fixed coupon, with a single maturity at which the whole principal is repaid. A great many bonds break one of those assumptions, and the variations are not curiosities. Some of the largest and most consequential parts of the market are special bonds. They differ in four broad ways: in how the coupon is set, in the options attached to them, in how they absorb losses, and in how they are backed.
Floating-rate notes change the coupon itself. Instead of a fixed rate, the coupon resets every few months to a reference rate, such as SOFR or Euribor, plus a fixed spread. Because the coupon rises and falls with prevailing rates, the price barely moves when yields change: a floating-rate note has almost no duration, which makes it a natural shelter when rates are rising, the very environment that punishes ordinary fixed-rate bonds.
Inflation-linked bonds, such as US TIPS or European linkers, change what the coupon and principal are worth. The principal is adjusted upward in step with a price index, and the coupon is paid on that growing principal, so the investor is repaid in real, inflation-protected terms. They are the direct answer to the inflation risk of Section 9: where an ordinary bond quietly loses purchasing power, an inflation-linked bond is built to preserve it, in exchange for a lower starting yield.
Convertible bonds carry an embedded option: the holder can exchange the bond for a fixed number of the issuer's shares. It is a bond with a lottery ticket attached. While the share price is low it behaves like an ordinary bond and pays a modest coupon; if the shares soar, the holder converts and captures the upside. In return for handing over that option, the issuer gets to borrow at a lower coupon, and that lower coupon is exactly the cost to the investor: less cash today for the chance of equity-like gains that may never arrive.
The most consequential special bonds are the loss-absorbing capital instruments banks issue, chief among them Additional Tier 1 bonds, also called contingent convertibles, or CoCos. They were invented after the 2008 crisis: having watched taxpayers rescue failing banks, regulators used the Basel III reforms to demand a layer of capital that could absorb losses while a bank was still alive, and the AT1 bond is that layer. It has no fixed maturity and pays a high coupon, but it hands the bank two powers no ordinary bond grants. First, the bank can cancel the coupon at its own discretion, at any time and without ever owing it back, and doing so is not a default, whereas an ordinary missed coupon would be. Second, it carries a trigger: if the bank's core capital ratio falls below a set level (commonly 5.125 or 7 percent), or the regulator judges the bank unviable, the bond is converted into equity or written down, sometimes to zero, while the bank keeps operating.
Those two powers are why AT1 pays so generously and why it is so treacherous: the coupon is the price of a bond that can quietly stop paying and then vanish, all without a formal default. It is a large market, several hundred billion dollars outstanding. Credit Suisse made the danger unforgettable in 2023, when about 17 billion dollars of its AT1 was written to zero, the contested case from Section 9. AT1 sits at the very bottom of the debt stack, and that position, not the bank's credit quality, is what makes it pay so much more than the same bank's senior bonds. The chart below makes the point concrete, using one bank's own bonds across the ladder.
Covered bonds change how the debt is backed. Common in Europe, they give the investor dual recourse: a claim on the issuing bank and, should the bank fail, a claim on a ring-fenced pool of high-quality assets, usually mortgages or public-sector loans, that stays on the bank's balance sheet and is kept topped up. That double protection makes them among the safest bonds a bank can issue, which is why their yields are so low. They should not be confused with the securitisations below, where the assets are moved off the balance sheet into a separate vehicle and the investor has no claim on the originator at all.
Other special bonds, in brief:
- Zero-coupon bonds. No coupons at all, sold at a deep discount and redeemed at face value, which gives them the longest duration for their maturity (Section 8).
- Callable bonds. The issuer can repay early, usually when rates fall, capping your upside; priced on yield-to-worst (Section 5).
- Puttable bonds. The mirror image: the holder can force early repayment, a rare and holder-friendly feature.
- Subordinated and Tier 2 bonds. Bank and corporate debt ranking below senior bonds, paying more for the lower rank (Section 10).
- Securitisations (ABS and MBS). Pools of loans or mortgages repackaged into bonds, whose AAA tranches sat at the centre of the 2008 crisis (Section 7).
- Green, social and sustainability bonds. Ordinary bonds whose proceeds are earmarked for labelled projects: standard structure, specific use of funds.
- Sukuk. Islamic bonds structured to comply with the prohibition on interest, paying returns from an underlying asset rather than as interest.
- Catastrophe bonds. Insurance-linked bonds that pay a high coupon but can wipe out the principal if a defined disaster, a hurricane or an earthquake, strikes.
The lesson is not to memorise every variety but to read what a bond actually is before buying it. The single word covers everything from a covered bond, in some ways safer than the bank that issued it, to an AT1 that can vanish overnight, to a catastrophe bond a single storm can erase. The coupon is never free: each of these instruments pays you for accepting one specific twist in the basic promise, and the work, always, is to know which twist you are being paid for.
12. Trading bonds in practice
A bond can be perfectly understood on paper and still be awkward to buy. Bonds mostly do not trade on a central exchange the way shares do. They trade over the counter, or OTC, negotiated between a buyer and a dealer who stands ready to quote a price, by phone or on electronic platforms. The reason is sheer variety: a single company may have dozens of separate bonds outstanding, each with its own coupon and maturity, and any one of them may go days without trading. There is no single screen price the way there is for a share.
That fragmentation makes liquidity, the ease of buying or selling near fair value, the quiet variable that matters most. US Treasuries are among the most liquid securities on earth, trading well over 900 billion dollars on an average day, so their bid-ask spread, the gap between the price a dealer will buy at and the price it will sell at, is razor thin. A small corporate or municipal bond might change hands only occasionally, and its bid-ask can be wide enough to hurt. That spread is a real cost, paid quietly on the way in and again on the way out.
There is also a quirk in what you actually hand over. The price you are quoted is the clean price, which leaves out the interest that has built up since the last coupon. What you pay is the dirty price, the clean price plus that accrued interest, so the seller is compensated for the slice of the next coupon they earned but will not be around to collect. The chart below shows how the two move through a coupon cycle.
A few mechanics round out the picture. Trades settle a day or two after they are agreed, T+1 for Treasuries and typically T+2 for corporates, which is simply when the cash and the bond actually change hands. Bonds also come in minimum denominations, often 1,000 dollars of face value but sometimes 100,000 or more for instruments aimed at institutions, which quietly puts parts of the market out of reach for a small investor buying directly.
Which is why, for most people, the practical route is not a pile of individual bonds but a bond fund or ETF. A fund delivers instant diversification across hundreds of issuers, a low minimum, daily liquidity, and someone else handling the settlement and the reinvesting, in exchange for a small annual fee. Buying individual bonds offers the opposite bargain: precise control over maturity and cash flows, and the certainty of a known sum on a known date if you hold to maturity, at the cost of needing size, time, and access. Neither is automatically right. The honest answer, as ever, depends on how much money, time, and certainty you need.
Earlier sections explained what a bond is and the risks it carries. This one is about the practical reality of buying one, holding it, and finding out what happens when the borrower fails. It is the part most introductions skip, and it is where a surprising amount of money is quietly made and lost.
Start with price, because a bond has two. The clean price is the one you see quoted, stripped of any interest that has built up since the last coupon. The dirty price, also called the invoice or full price, is what you actually pay: the clean price plus the accrued interest, the slice of the next coupon the seller has earned by holding the bond up to the day of sale. Buy halfway between coupon dates and you reimburse the seller for half a coupon on top of the quoted price. Markets quote clean prices so bonds can be compared without the sawtooth of accrued interest getting in the way, but the cash that leaves your account is always the dirty price.
How fast that interest accrues depends on the coupon frequency. Most US Treasuries and dollar corporate bonds pay semi-annually, two coupons a year; many European government bonds pay annually, just one. The frequency sets how often accrued interest resets to zero, and through the day-count convention it makes a real, if small, difference to the yield. The graph below shows the dirty price climbing as interest accrues, then snapping back to the clean price on each payment date.
There is one more price wrinkle, and it is the main cost of trading a bond. Bonds change hands over the counter, through dealers, rather than on a central exchange, so at any moment a dealer quotes two prices: the bid, at which it will buy the bond from you, and the ask, or offer, the higher price at which it will sell it to you. The gap between them is the bid-ask spread: the dealer's margin, and your cost of a round trip. For the most liquid bonds, on-the-run US Treasuries, the spread is a sliver, a fraction of a point; for a small corporate issue, a high-yield name, or an emerging-market bond, it can be a point or two, sometimes more. And each side implies a different yield: pay the higher ask and your yield to maturity is lower, sell at the lower bid and the yield is higher, so the same bond carries not one yield but a buying yield and a selling yield. For liquid bonds the gap is trivial. For illiquid ones it is not, and anyone who might have to sell before maturity should treat the spread as a real haircut on the return, not a rounding error.
There are three ways to own bonds, and the choice matters more than beginners expect. A direct line is a single bond from a single issuer: you know exactly what you hold and when your money comes back, but you carry that one borrower's risk and must do the credit work yourself. A bond fund spreads your money across hundreds of issuers and is actively managed, but it never matures, so its value floats with rates indefinitely. A bond ETF does much the same for a lower fee and trades on an exchange all day like a share, which is convenient until a stressed market, when the ETF can trade at a discount to the very bonds it holds, precisely when you most want to sell. Diversification and liquidity on one side, certainty of maturity on the other: there is no single right answer.
The lesson of this section is that the headline coupon and the rating are the easy part. The price you actually pay, the spread you cross to trade, and the vehicle you buy through are where the practical reality of bond investing quietly lives, and where the careless lose more than they expect.
13. The role of bonds in a portfolio
The previous sections looked closely at a single bond: how it is priced, what can go wrong, where it sits when an issuer fails. This section pulls the camera back. An investor almost never owns one bond in isolation. The real question is not whether bonds are good or bad, but what job they do alongside everything else you might own: stocks, cash, gold, property. To answer that, it helps to look at a very long stretch of history.
The chart below draws on one of the most cited datasets in finance, assembled by Professor Aswath Damodaran of NYU Stern, which tracks the return on the major asset classes back to 1928. It asks a simple question: if you had put $100 into each at the start of 1928, what would it be worth at the end of 2025, almost a century later? Use the buttons to add or remove each line. The scale is logarithmic, so every gridline is ten times the one below it, which is the only way to fit such different outcomes on one picture.
A note on what follows: every series here is a US asset class measured in US dollars, and stocks means the S&P 500 with dividends reinvested.
Three lessons jump out. First, over a full century stocks win, and not by a little: $100 became more than $1.1 million, far ahead of everything else. Second, the price of that result was a stomach-churning ride. Stocks swung about 19 percent a year and lost half their value more than once along the way. Third, look at where bonds sit. A 10-year Treasury bond turned $100 into about $7,700 and Baa corporate bonds into roughly $54,000, a fraction of stocks, but they did it far more smoothly, with annual swings of only 7 to 8 percent.
That smoothness is the whole point, and it is why bonds earn their place. Their job in a portfolio is rarely to win the race. It is to do four quieter things. They provide ballast, dampening the swings of a stock-heavy portfolio so the owner can actually stay invested through a crash rather than selling at the bottom. They pay income, a contractual coupon that arrives whether or not markets are cheerful. They offer diversification, because high-quality bonds often rise when stocks fall, as investors flee to safety. And they allow capital preservation and the matching of money to a known future need, a tuition bill or a retirement date, with far more certainty than equities can offer.
The numbers reward a second look on a risk-adjusted basis. Corporate bonds compounded at about 6.6 percent a year with roughly 7.7 percent volatility; stocks compounded near 10 percent but with almost three times the volatility. Measured as return per unit of risk, good-quality bonds have historically been remarkably efficient. The lesson is not that bonds beat stocks, they do not, but that the right blend of the two can deliver most of the journey with much less of the turbulence.
We can see the whole picture in one frame by plotting each asset's average yearly return against its volatility, the size of its typical year-to-year swing. The chart below does this for 1972 onward, the era of freely floating gold, and adds two blended portfolios: the classic 60/40 (60 percent stocks, 40 percent Treasury bonds) and a 55/35/10 version that trims both to hold 10 percent in gold. Both blends land toward the upper left, the most desirable corner, because mixing assets that do not move in lockstep lowers risk faster than it lowers return. Over this period the 55/35/10 even edged ahead of the 60/40 on both counts, a reminder of diversification's power, though the exact winner depends on the period you choose.
One number hides inside that volatility figure: the worst year. The grid below stacks every year from 1972 to 2025 into 5 percent return buckets, one block per year, with all eight panels drawn to the same scale so the spread itself tells the story. The wider and flatter the shape, the riskier the holding. The worst single years line the risk profiles up cleanly: gold fell 33 percent in 1981 and stocks 37 percent in 2008, the two widest shapes; Treasury bonds lost 18 percent and corporate bonds 15 percent in the same brutal 2022; real estate dropped 12 percent in 2008; and T-Bills never had a losing year at all. The blends land in between: the 60/40 worst year was minus 18 percent in 2022, while the gold-tilted 55/35/10 held its worst to minus 16 percent, a touch more resilient precisely because its three holdings rarely fall together.
None of this makes bonds safe in every weather. 2022 was a sharp reminder that bonds and stocks can fall together when inflation and interest rates jump. Cash, the calmest line on the chart, barely outran inflation over the century and after tax often lost ground, which is the quiet cost of holding too much of it. And gold delivered respectable long-run growth but with equity-like turbulence and no income at all. The honest conclusion is the unglamorous one: there is no single best asset, only a mix suited to a particular horizon, goal, and tolerance for discomfort. Bonds are not the exciting part of that mix. They are, more often, the part that lets the rest of it work.
14. A glossary of key terms
Every field has its own vocabulary, and bonds have more than most. Here are the key terms used in this lesson, gathered in one place and written in plain language. Start typing in the box to filter the list.
Every field has its own vocabulary, and bonds have more than most. Here are the key terms used in this lesson, gathered in one place and written in plain language. Start typing in the box to filter the list.